
decoding healthcare
A digital product that showcases complex healthcare analytics & data in an understandable way
Goal
Create a data-driven, interactive tool that turns complex healthcare analytics into clear, tangible insights — helping businesses and decision-makers understand, act on, and trust their data.
Context
Client Project at The Dock
Winter 2024

Starting Point
In healthcare, data is abundant, but understanding it is a challenge. The business wanted to showcase its analytics capabilities in a way that spoke to both data professionals and business leaders — translating raw numbers into insights that drive action.
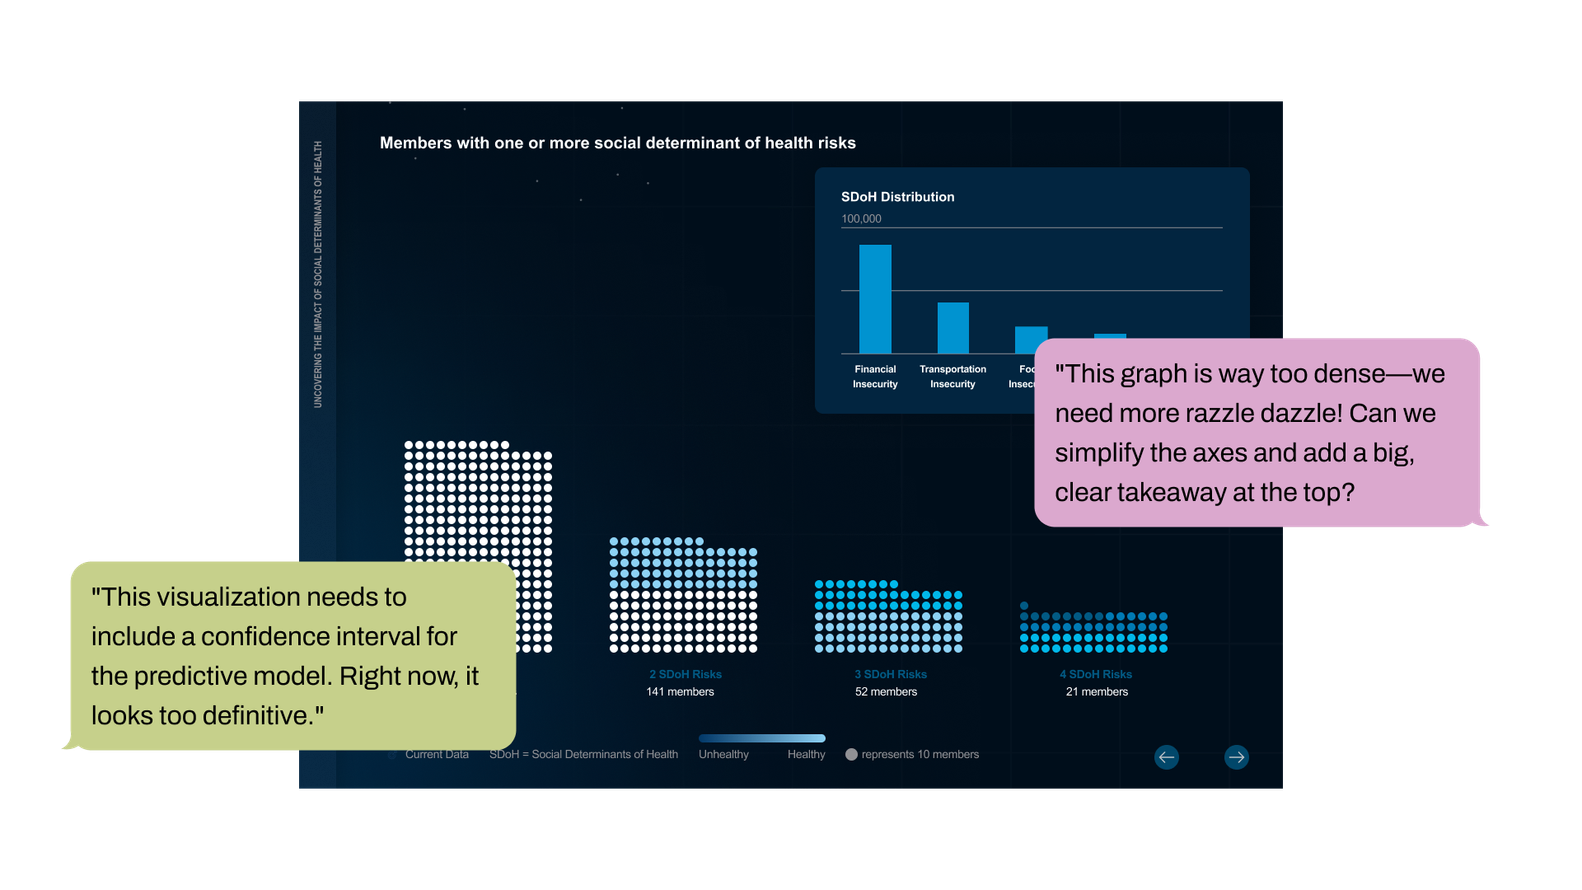
The challenge
- Make complex healthcare data intuitive — so stakeholders at all levels can easily engage with the insights.
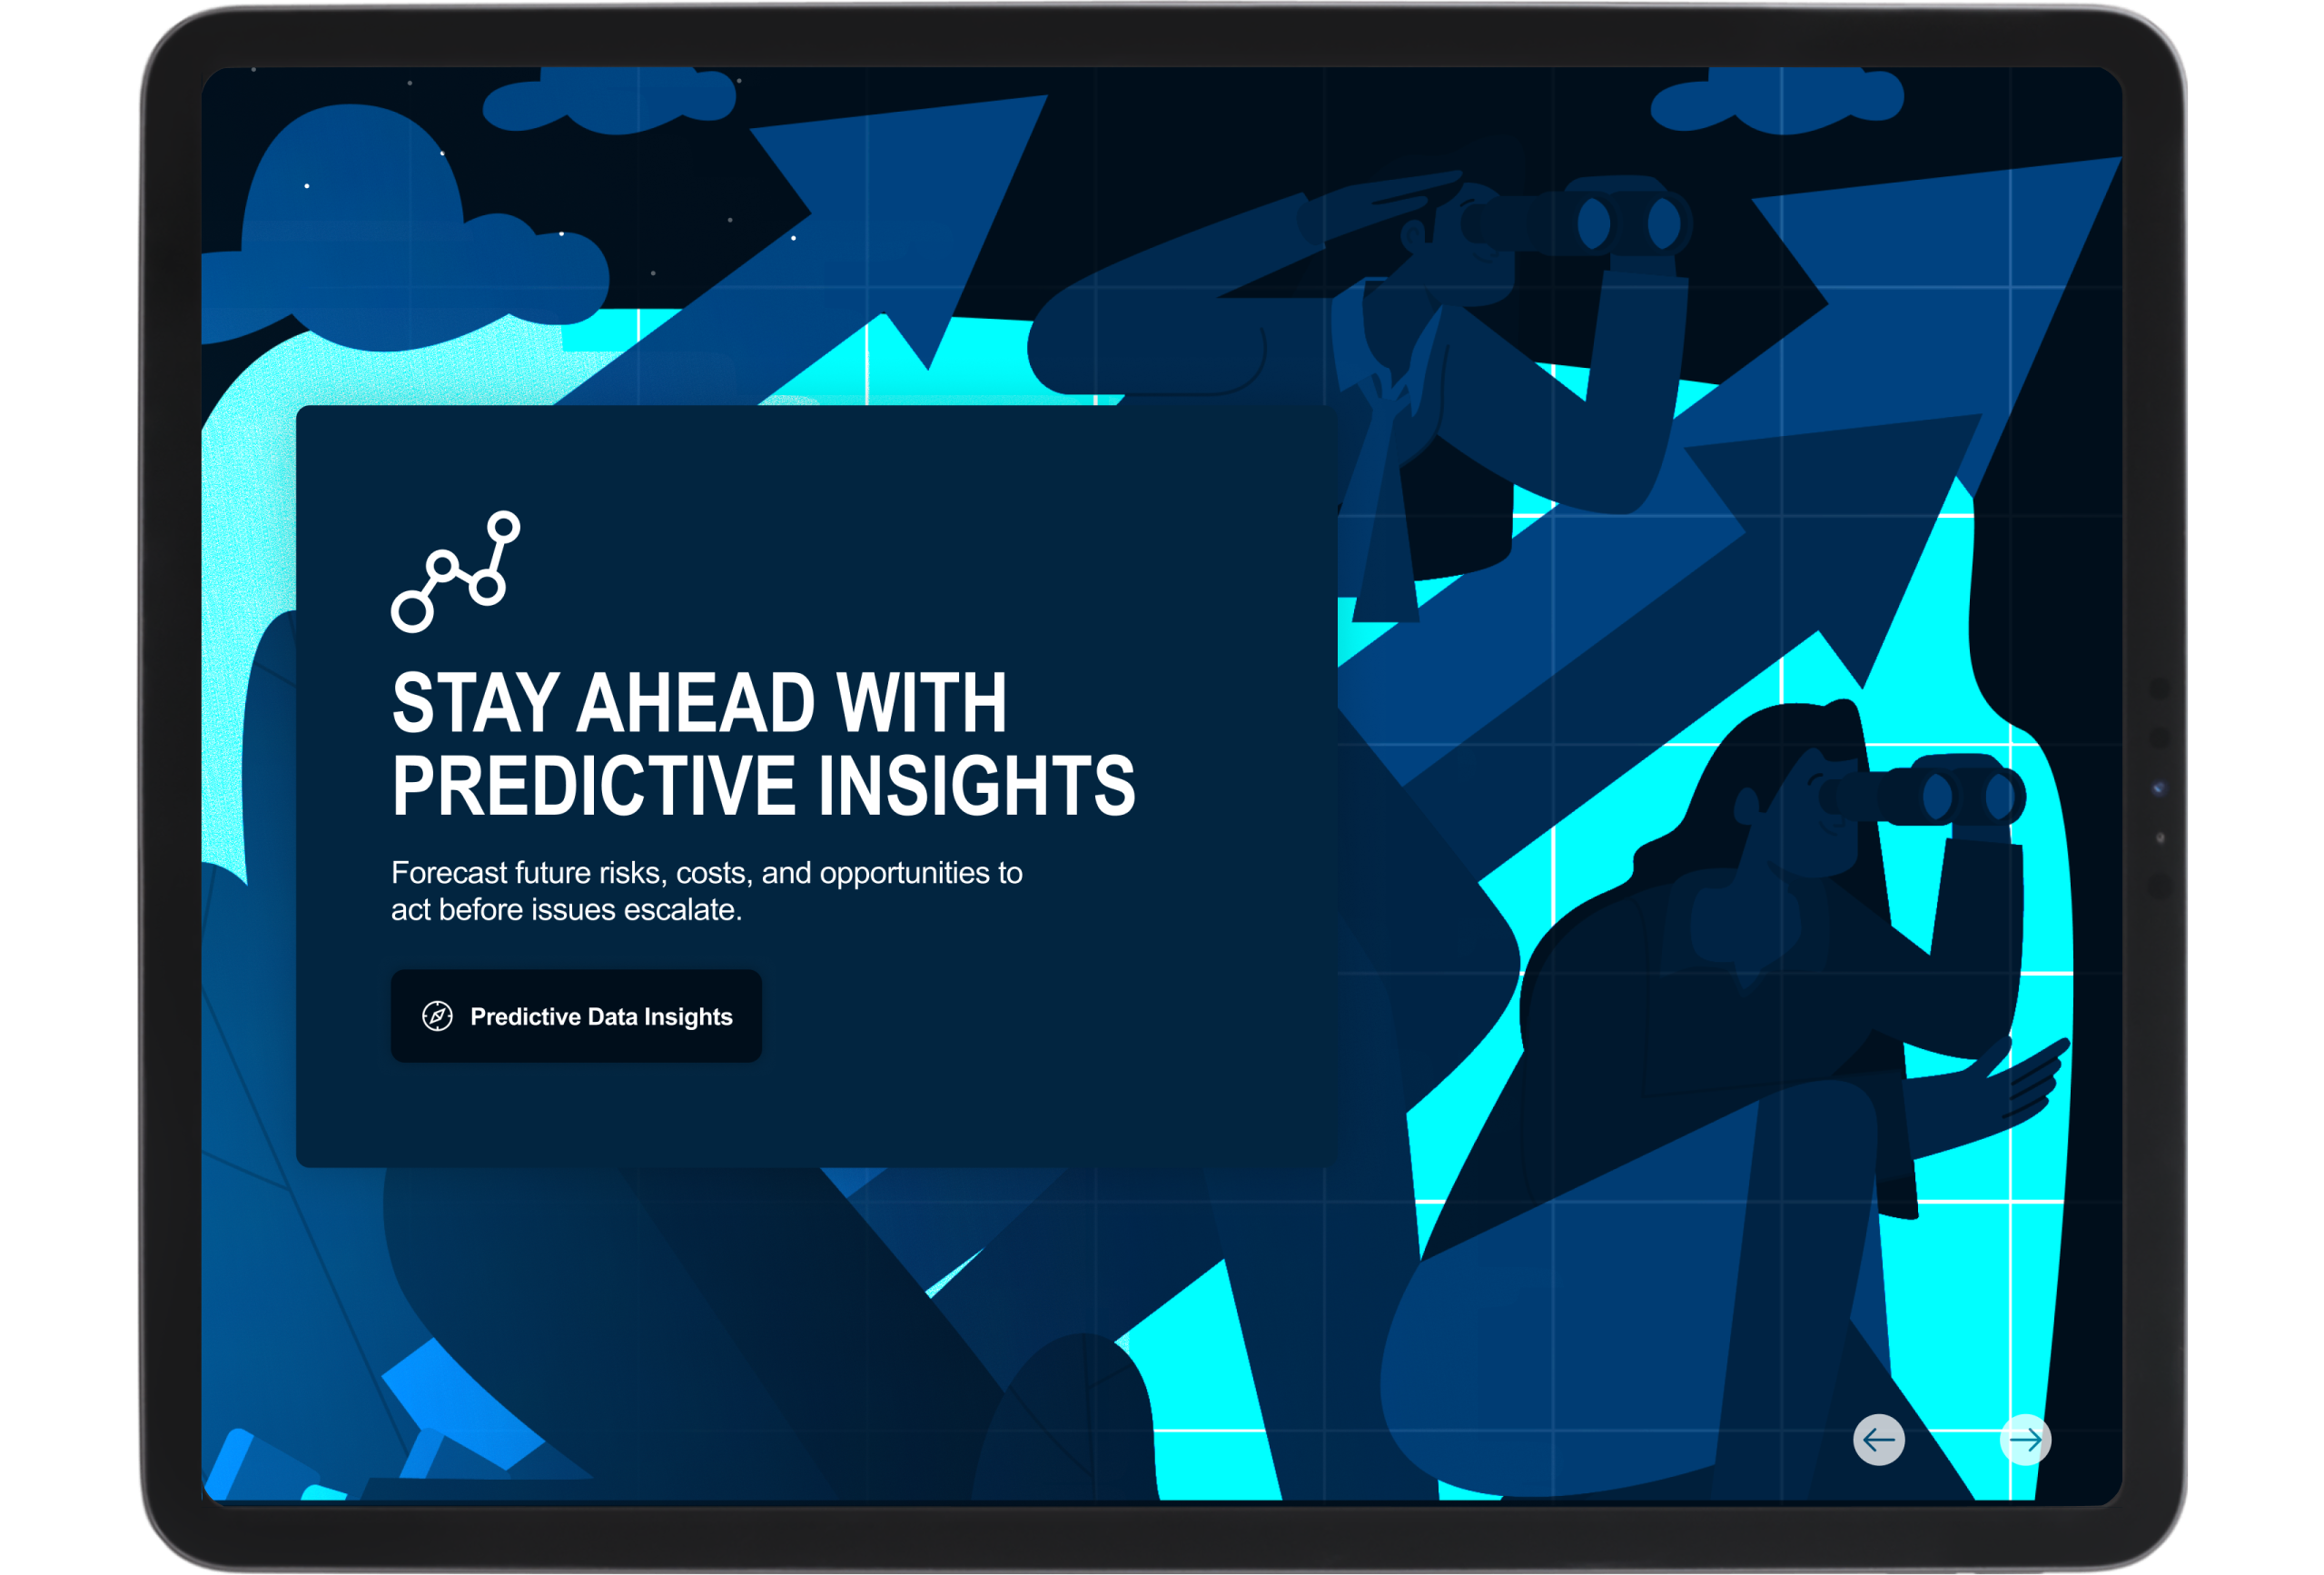
- Showcase real-world impact — turning predictive models into clear, compelling narratives that highlight risks, costs, and opportunities.
Our approach was not just about displaying data, but about making it tangible, relevant, and understandable — so that people could see what it means, why it matters, and what to do next.
Outcome
Making data actionable means making it understandable. This project was about more than just visualizing analytics — it was about turning healthcare data into a decision-making tool that speaks to everyone.
By combining design, data storytelling, and tech we transformed complex numbers into clear, compelling insights — helping businesses and stakeholders not just see the data, but truly understand it.
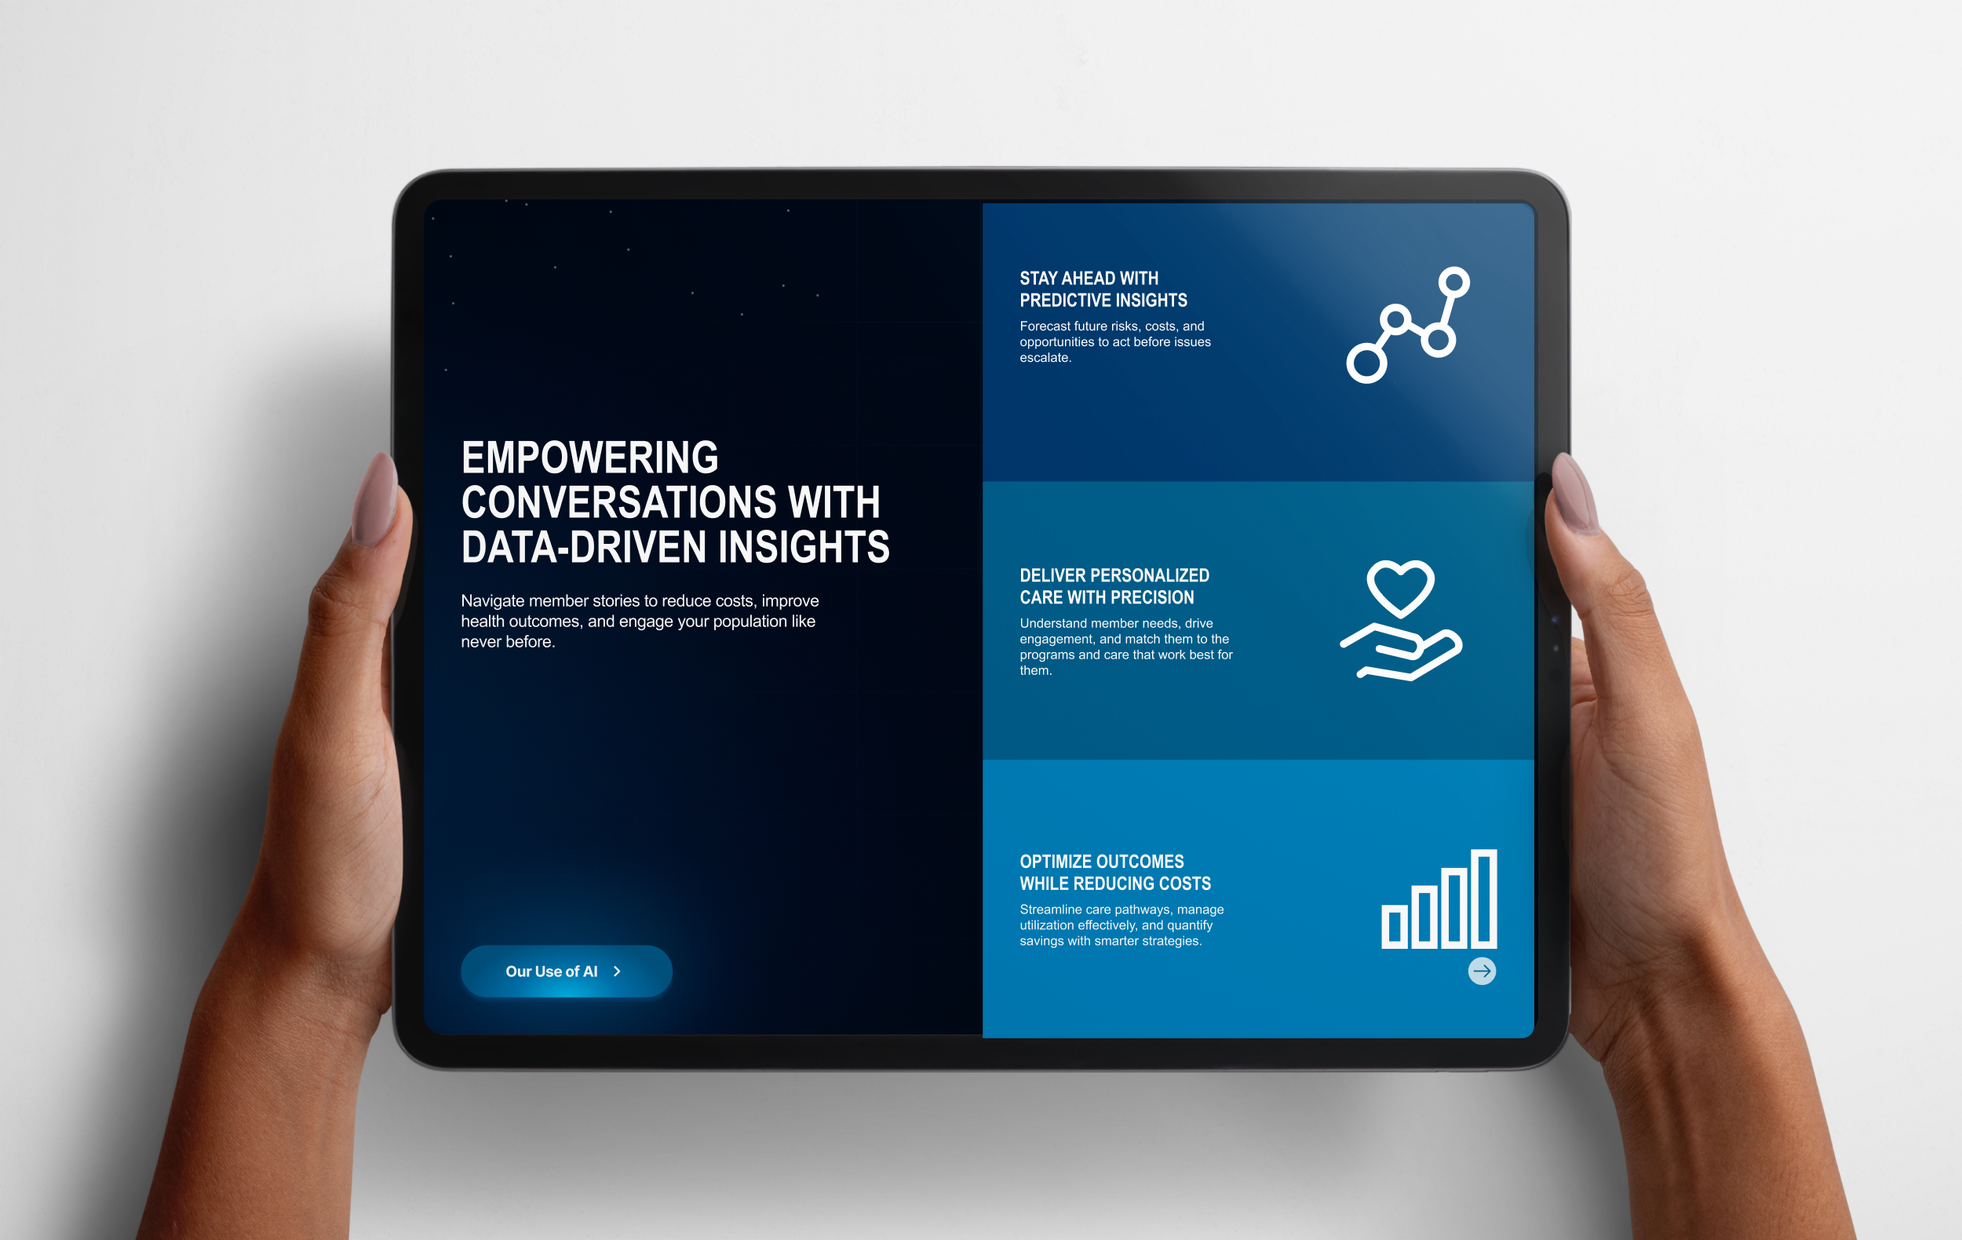
Data Storytelling with Visual Context
We invested time in understanding the business’s data and analytics capabilities to shape one compelling narrative — not just a series of graphs.
By structuring insights into a logical flow, we created a clear story arc that guides clients through how data drives smarter healthcare decisions.
Designed for On-the-Go
Designed for on-the-go sales conversations, the tool is fully optimized for tablet use, making it easy to showcase insights in client meetings. With touch interactions, users can navigate between pages.
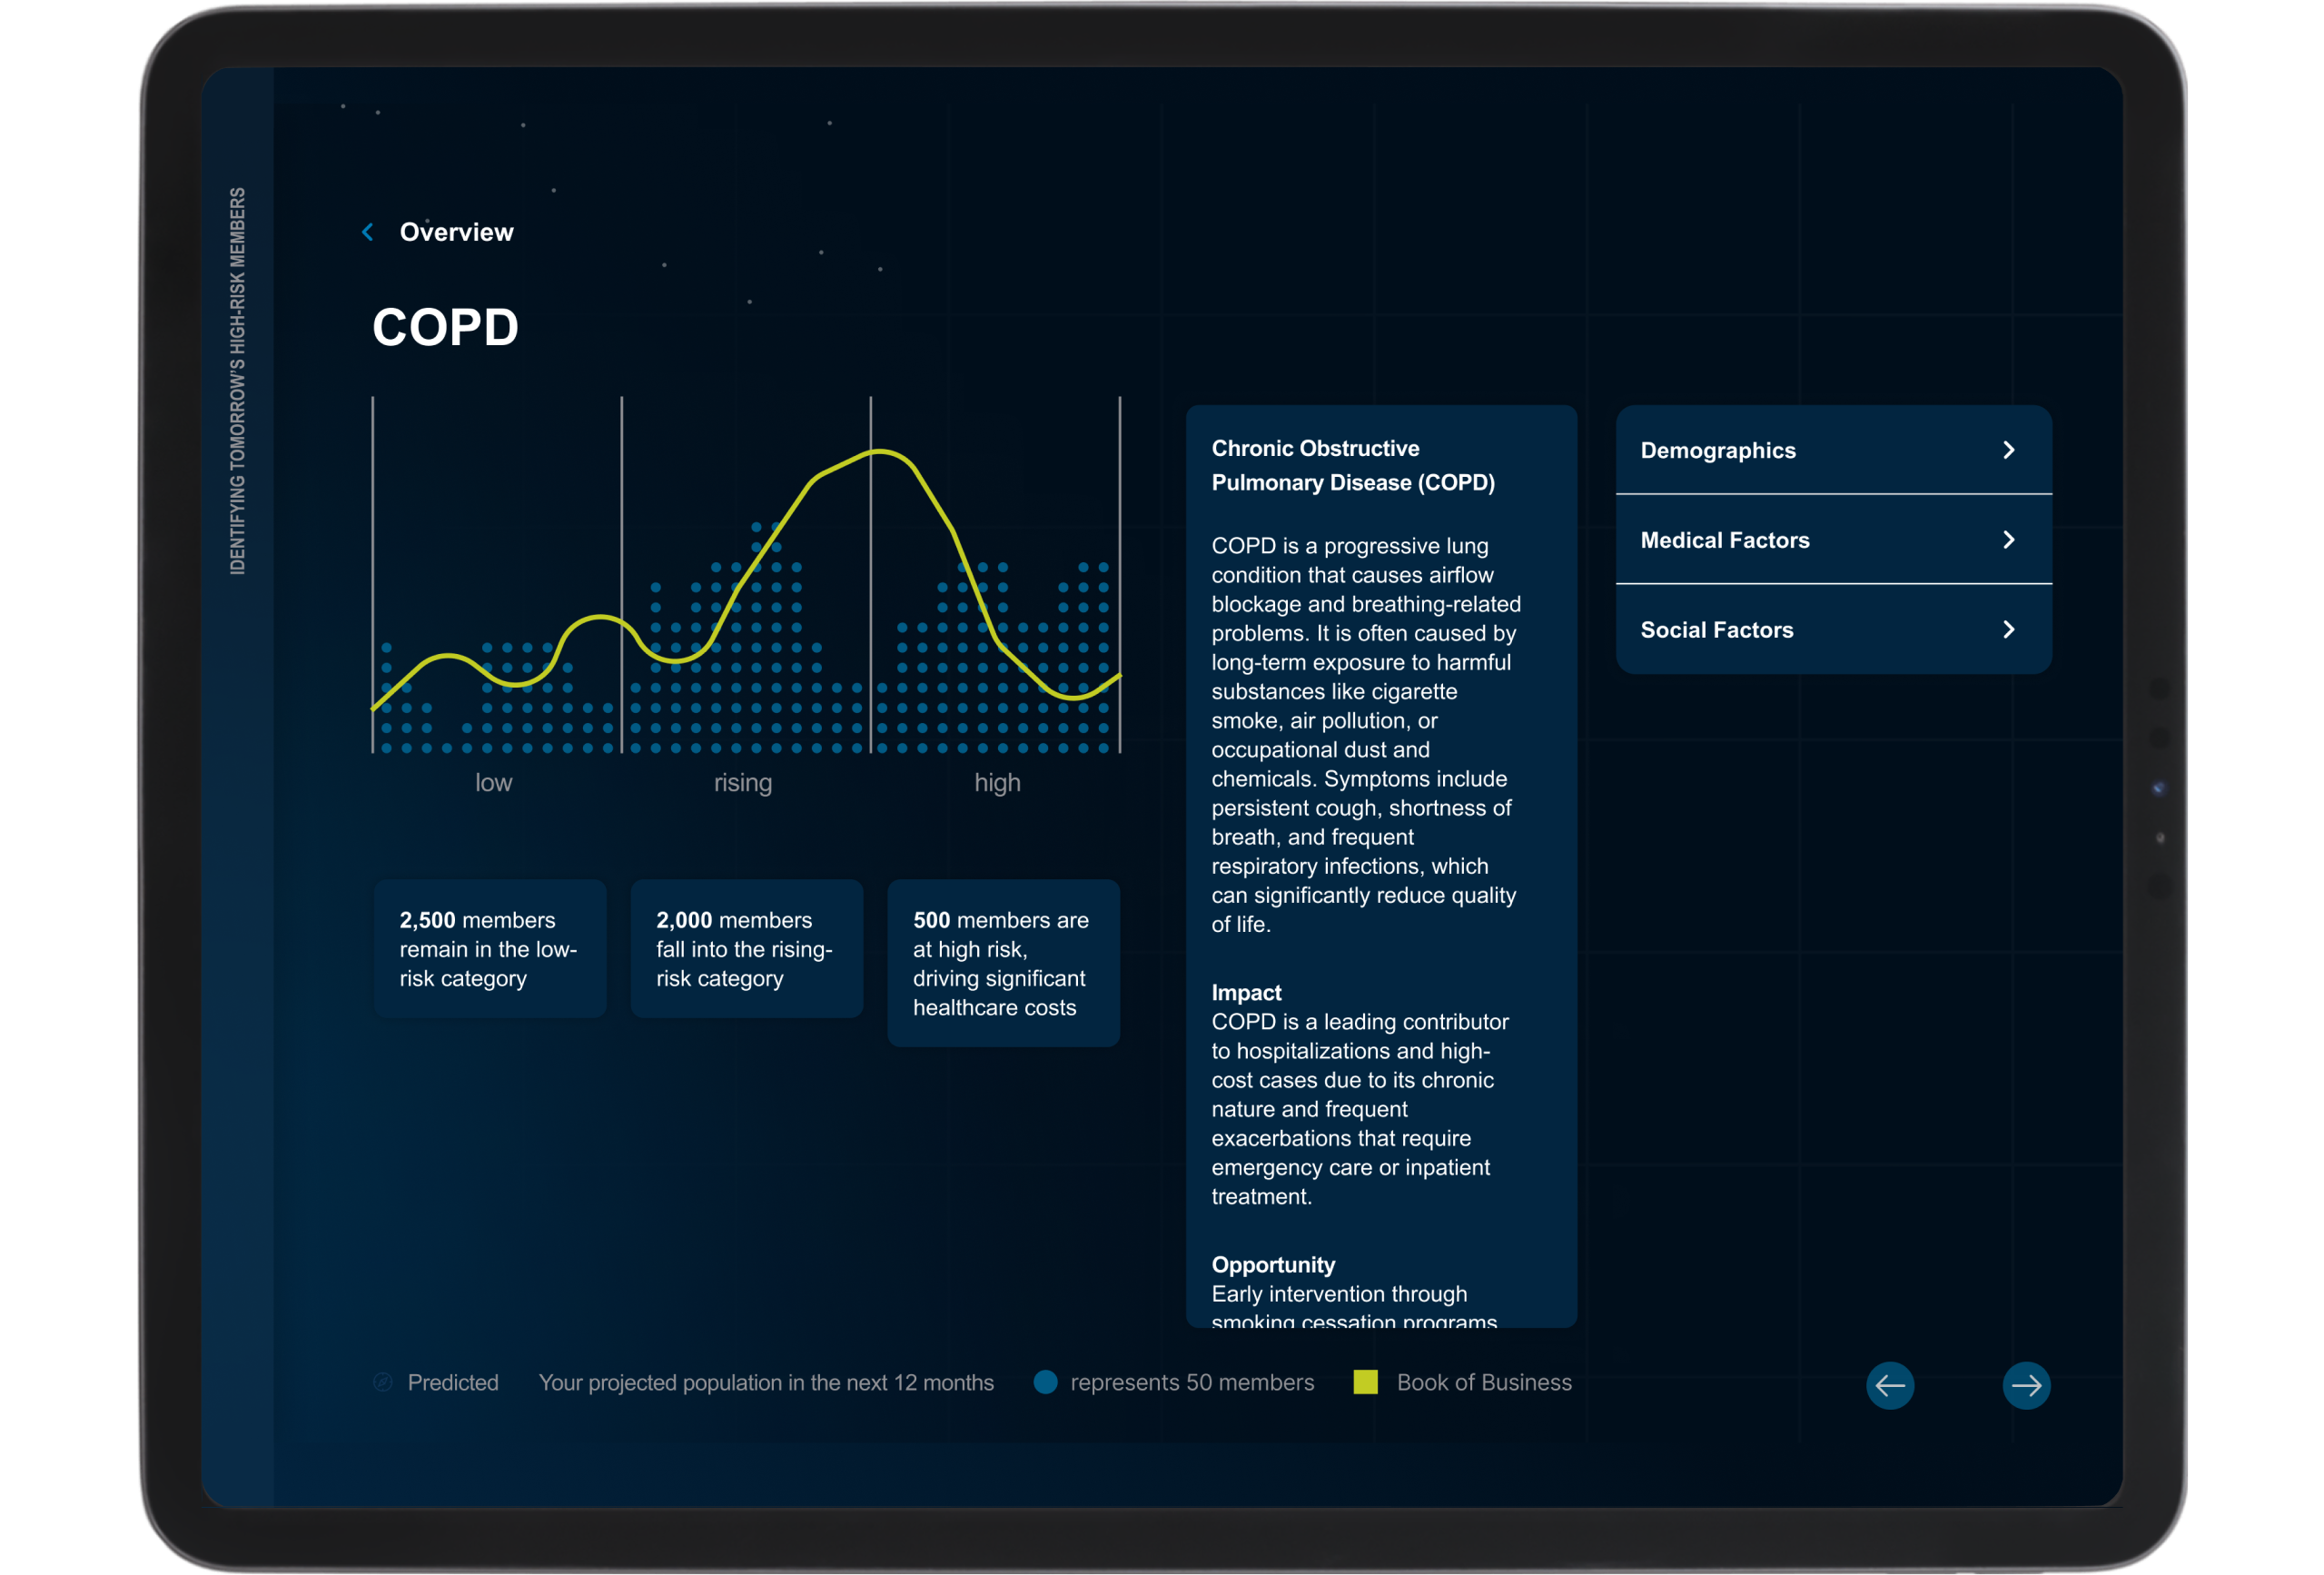
Real-Time Data Visualizations
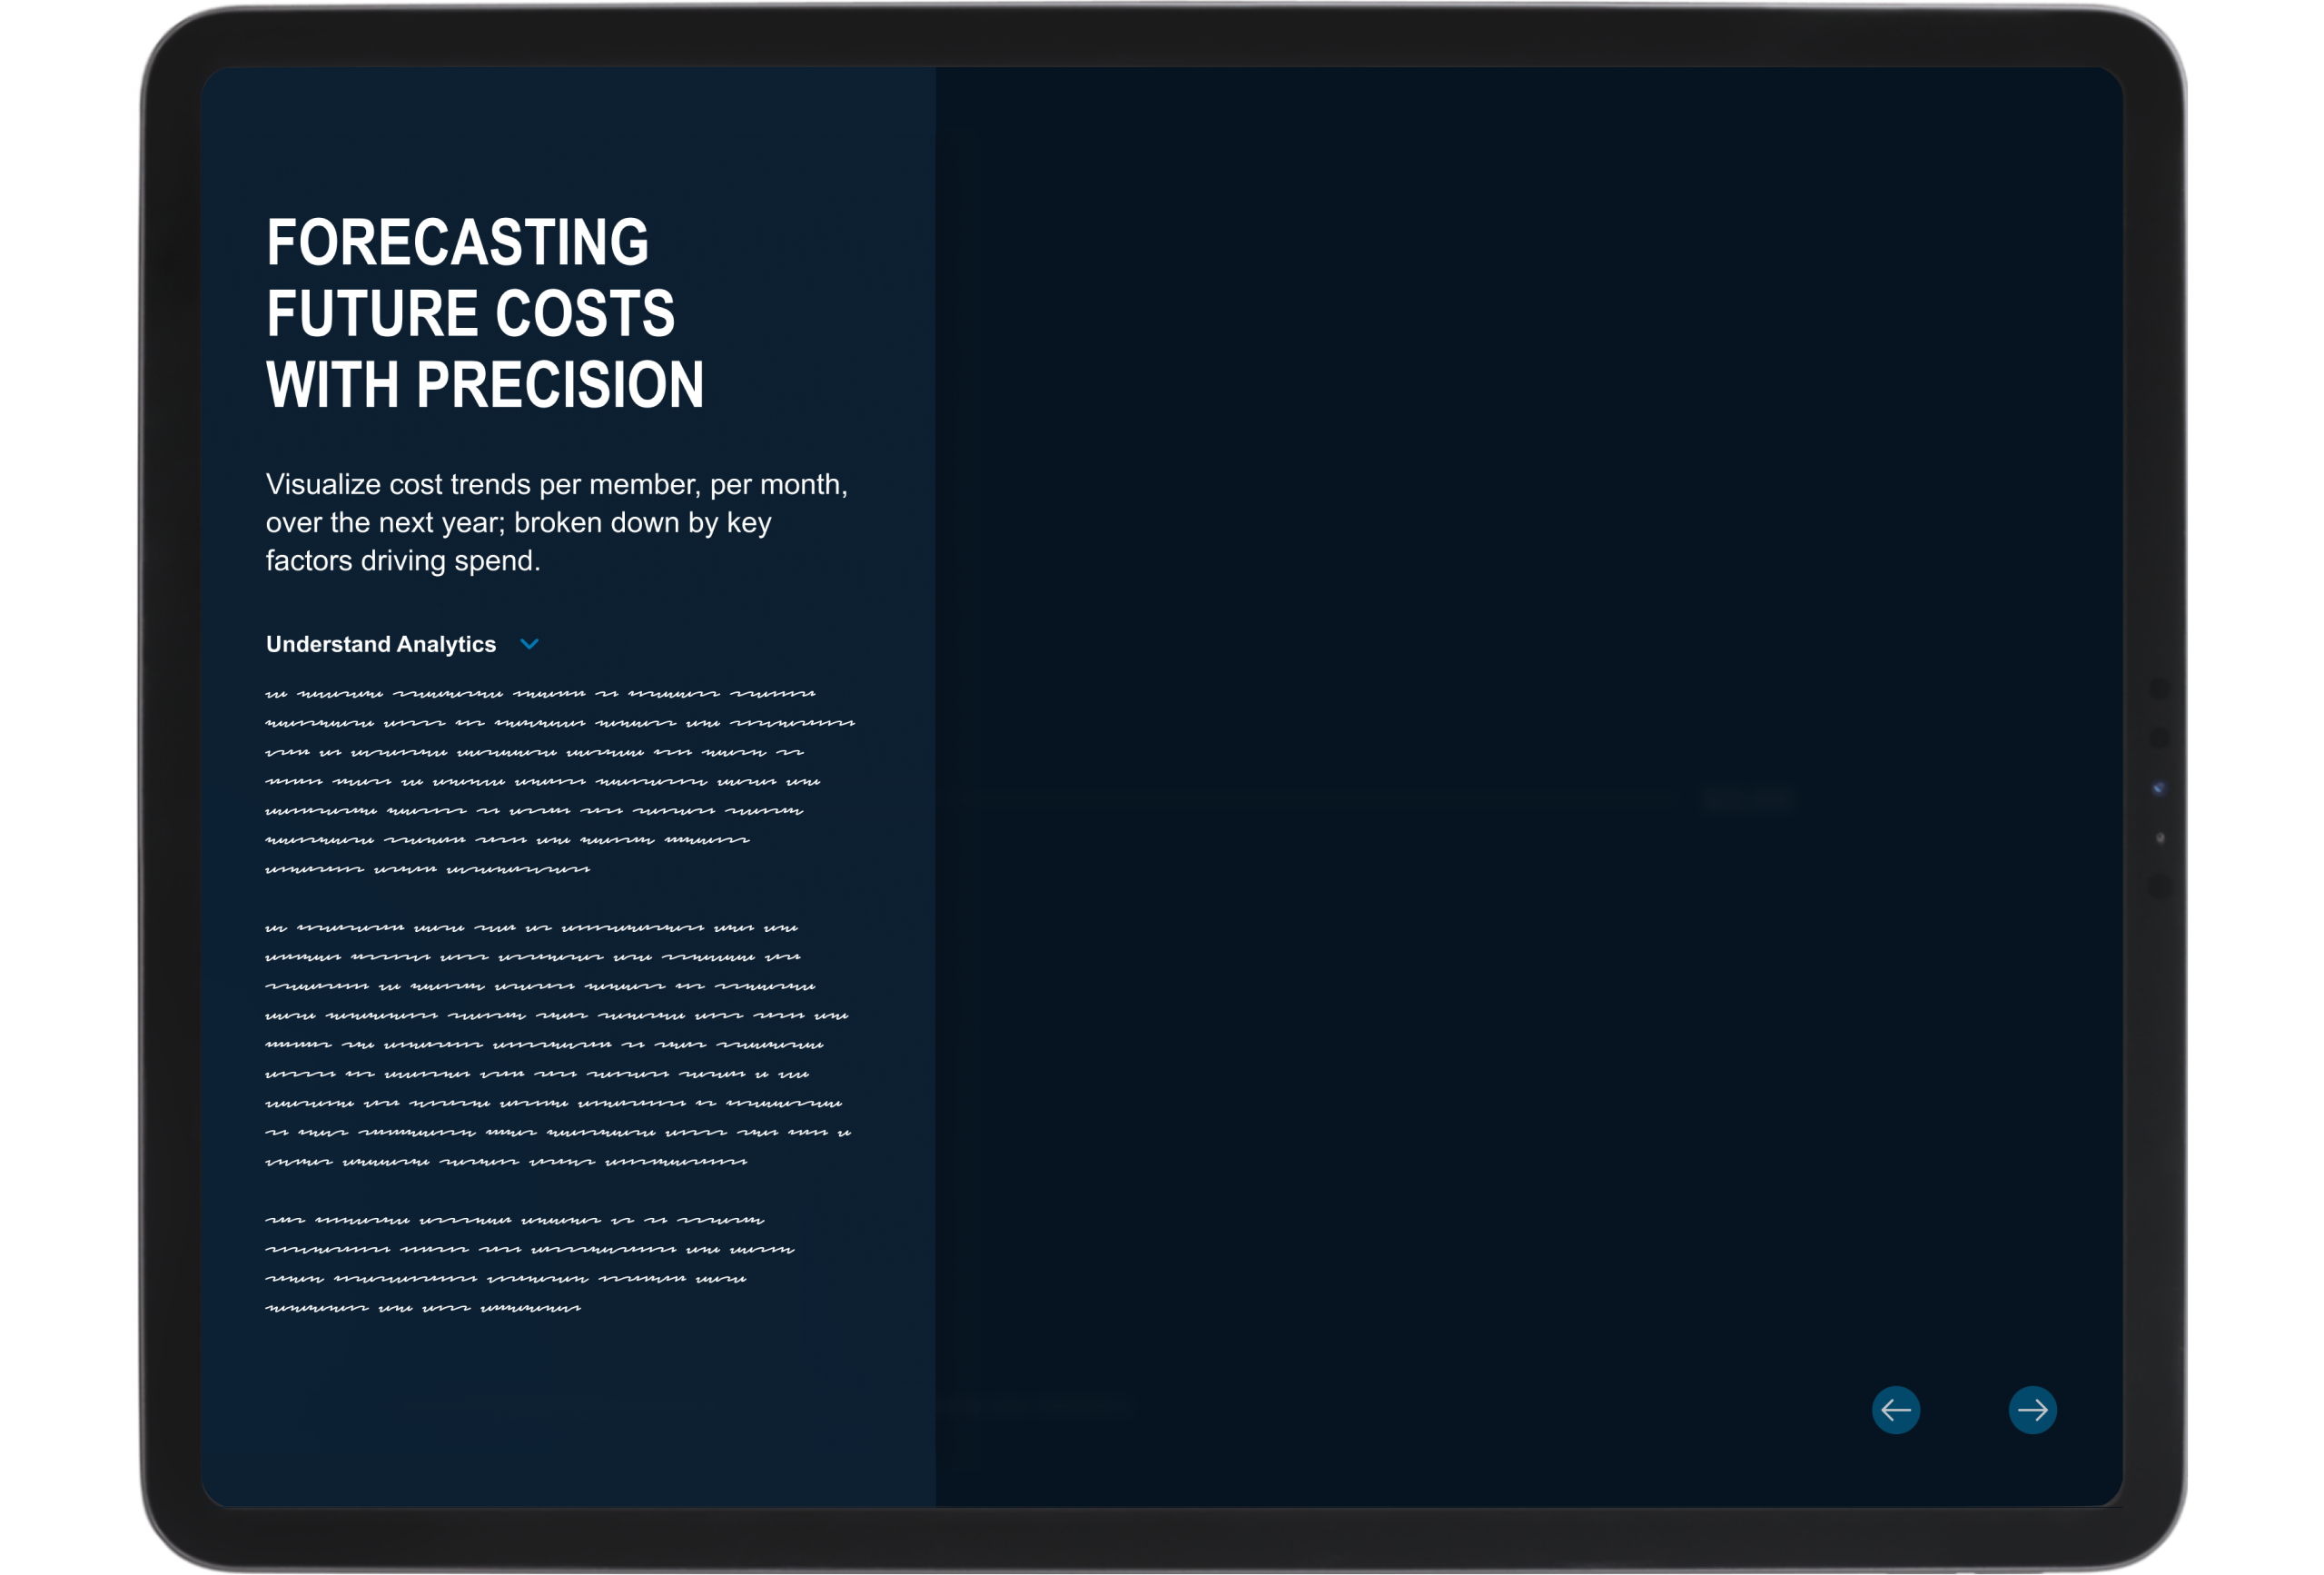
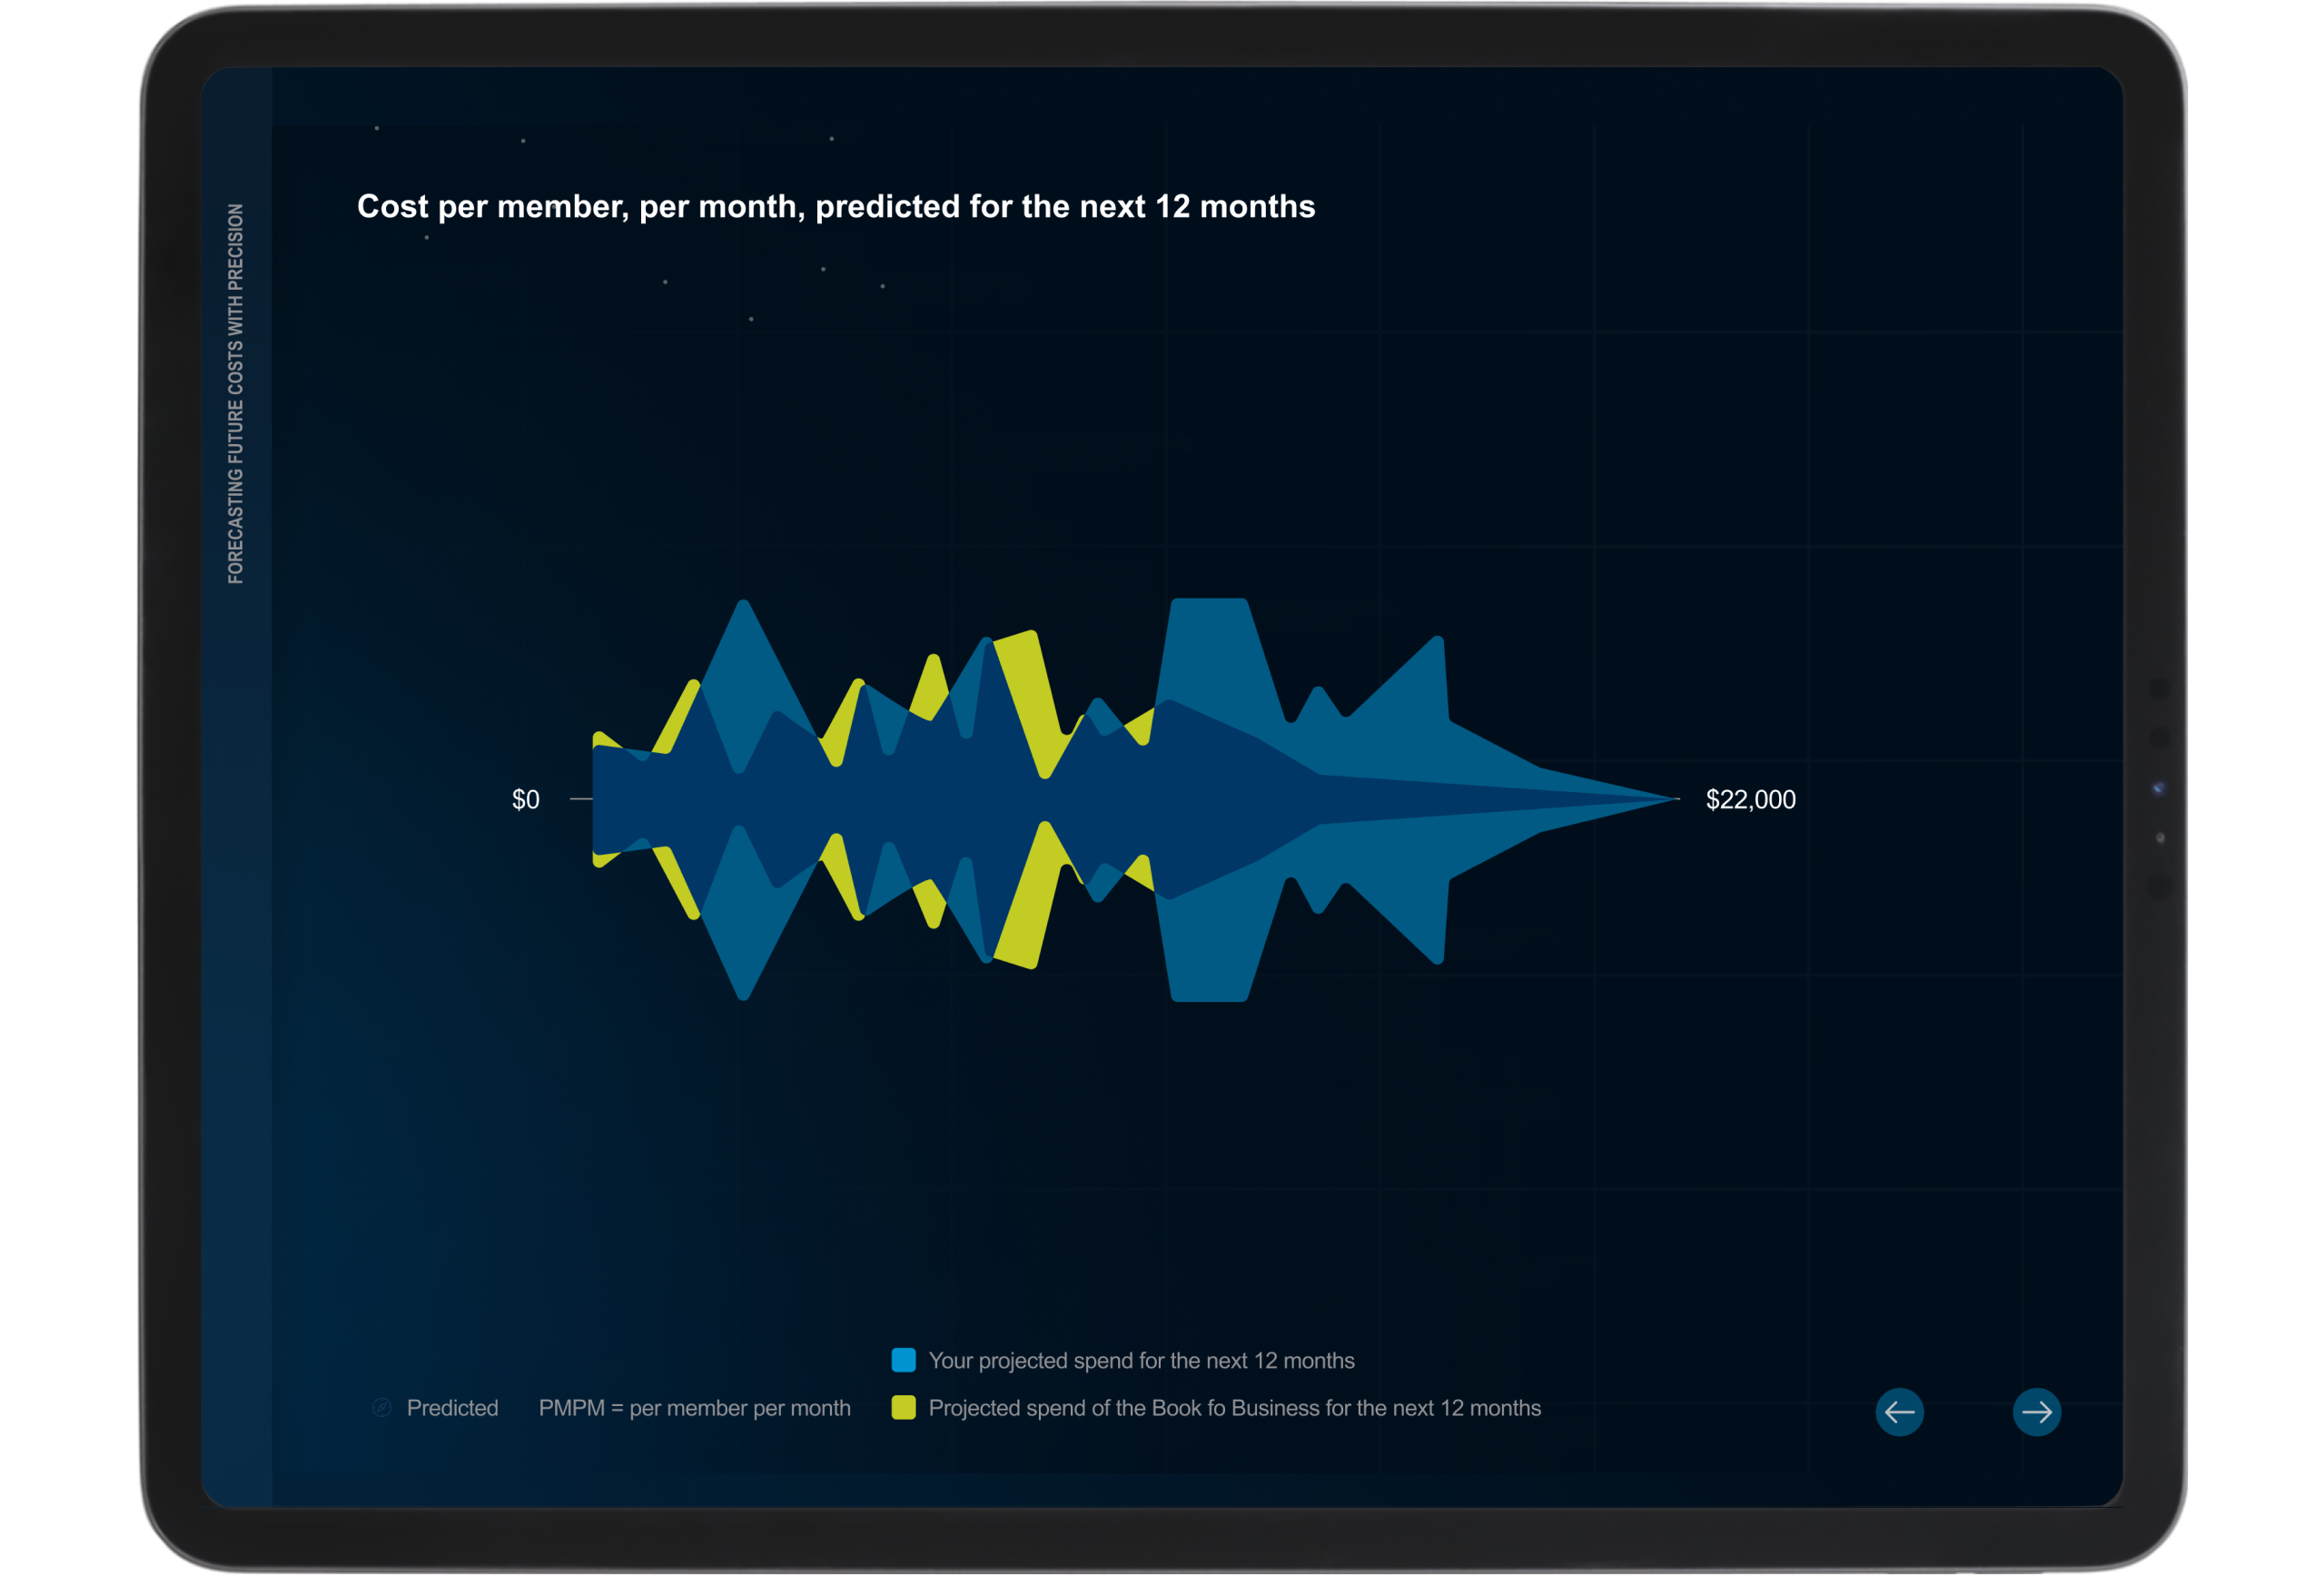
Each graph transforms complex analytics into clear insights. From future cost trends and health engagement to risk forecasting and utilization management, the tool presents real data in a way that speaks to decision-makers — allowing clients to see the impact of analytics in real time.
High-Level Overview & Deep Dives
Built for flexibility, the tool enables users to scan broad trends at a glance or dive deeper into specifics with a tap.
Whether presenting a bird’s-eye view of key metrics or drilling down into detailed data points, the experience is structured to adapt to different data literacy levels.
Approach
Unifying Different Stakeholder Needs
This tool had to work for two very different audiences:
- Data teams, who needed it to be a precise and sophisticated representation of their analytics.
- Sales teams, who needed it to be clear, engaging, and easy to present to potential clients.
Balancing these needs required constant iteration, client conversations, and visual testing to ensure the tool was both technically accurate and intuitively understandable.
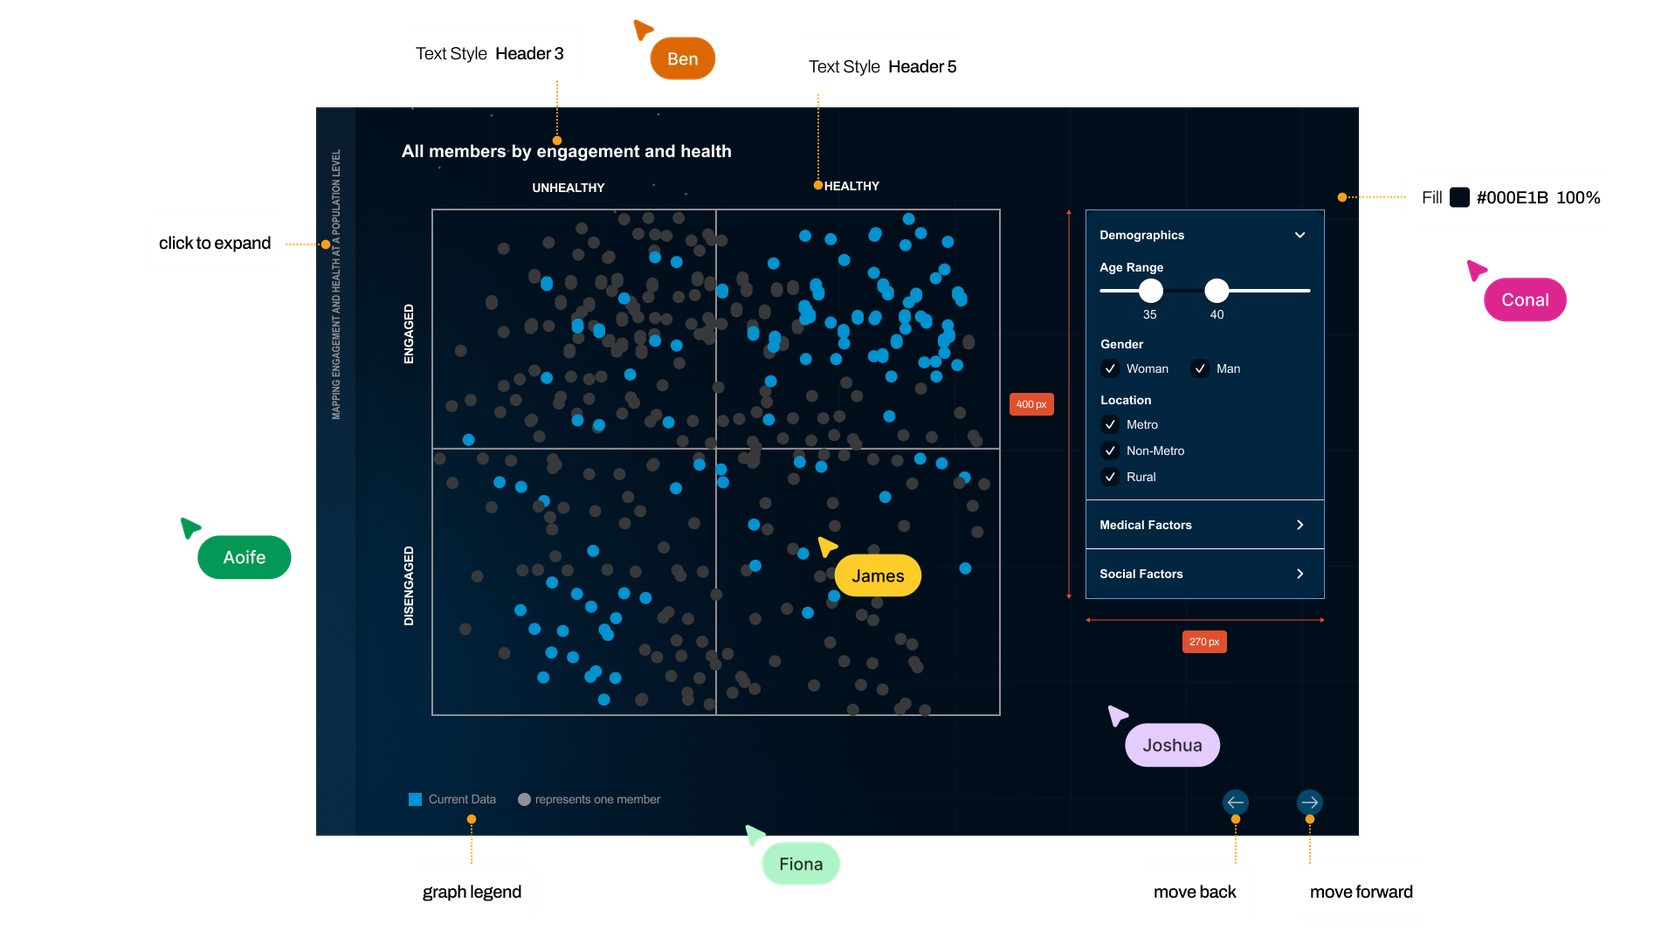
Collaboration with Tech
With just 7 weeks to bring this from concept to working product, tight collaboration with the tech team was essential.
I was responsible for handing off designs & together we iterated based on feasibility constraints. Working closely with tech ensured the final tool not only looked great but functioned flawlessly.
Huge credit to the tech team for making the data fully interactive and even integrating real client data into the live version.
Client Feedback
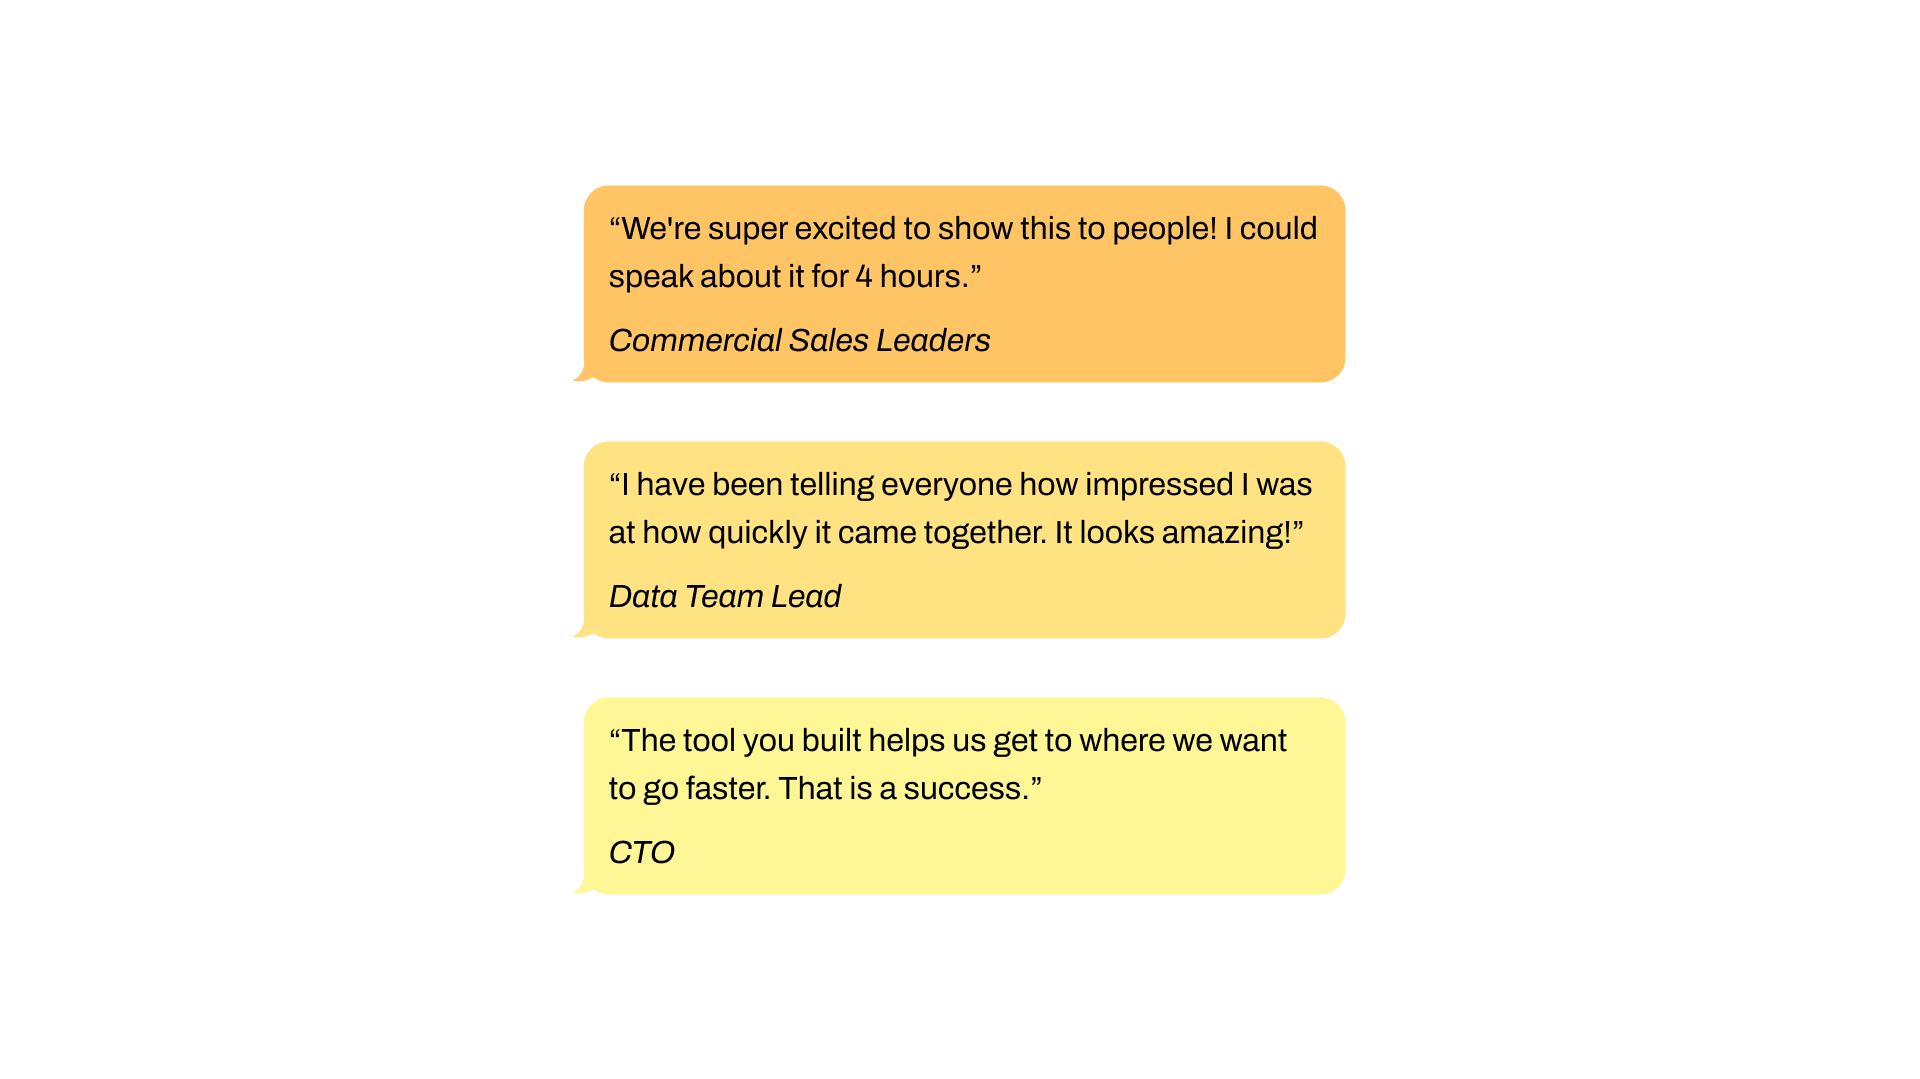
A Moment of Reflection
This project completely changed how I think about data visualization. I used to believe it was mostly about making numbers look good — but now I realize it's about so much more.
It’s about deeply understanding the data, structuring it into a clear story, and simplifying it enough that anyone can grasp its meaning. And even after all that, you still have to make it visually compelling.
Honestly, I now fully understand just how much I don’t know. Designing something that makes sense to data experts while also being intuitive for sales teams was way harder than I expected.
I’ve gained so much appreciation for how much knowledge and skill it actually takes to simplify something so complex — and then, on top of that, make it look good.

Back
decoding healthcare
A digital product that showcases complex healthcare analytics & data in an understandable way
Goal
Create a data-driven, interactive tool that turns complex healthcare analytics into clear, tangible insights — helping businesses and decision-makers understand, act on, and trust their data.
Context
Client Project at The Dock
Winter 2024

Starting Point
In healthcare, data is abundant, but understanding it is a challenge. The business wanted to showcase its analytics capabilities in a way that spoke to both data professionals and business leaders — translating raw numbers into insights that drive action.
The challenge
- Make complex healthcare data intuitive — so stakeholders at all levels can easily engage with the insights.
- Showcase real-world impact — turning predictive models into clear, compelling narratives that highlight risks, costs, and opportunities.
Our approach was not just about displaying data, but about making it tangible, relevant, and understandable — so that people could see what it means, why it matters, and what to do next.
Outcome
Making data actionable means making it understandable. This project was about more than just visualizing analytics — it was about turning healthcare data into a decision-making tool that speaks to everyone.
By combining design, data storytelling, and tech we transformed complex numbers into clear, compelling insights — helping businesses and stakeholders not just see the data, but truly understand it.
Data Storytelling with Visual Context
We invested time in understanding the business’s data and analytics capabilities to shape one compelling narrative — not just a series of graphs.
By structuring insights into a logical flow, we created a clear story arc that guides clients through how data drives smarter healthcare decisions.
Designed for On-the-Go
Designed for on-the-go sales conversations, the tool is fully optimized for tablet use, making it easy to showcase insights in client meetings. With touch interactions, users can navigate between pages.
Real-Time Data Visualizations
Each graph transforms complex analytics into clear insights. From future cost trends and health engagement to risk forecasting and utilization management, the tool presents real data in a way that speaks to decision-makers — allowing clients to see the impact of analytics in real time.
High-Level Overview & Deep Dives
Built for flexibility, the tool enables users to scan broad trends at a glance or dive deeper into specifics with a tap.
Whether presenting a bird’s-eye view of key metrics or drilling down into detailed data points, the experience is structured to adapt to different data literacy levels.
Approach
Unifying Different Stakeholder Needs
This tool had to work for two very different audiences:
- Data teams, who needed it to be a precise and sophisticated representation of their analytics.
- Sales teams, who needed it to be clear, engaging, and easy to present to potential clients.
Balancing these needs required constant iteration, client conversations, and visual testing to ensure the tool was both technically accurate and intuitively understandable.
Collaboration with Tech
With just 7 weeks to bring this from concept to working product, tight collaboration with the tech team was essential.
I was responsible for handing off designs & together we iterated based on feasibility constraints. Working closely with tech ensured the final tool not only looked great but functioned flawlessly.
Huge credit to the tech team for making the data fully interactive and even integrating real client data into the live version.
Client Feedback
A Moment of Reflection
This project completely changed how I think about data visualization. I used to believe it was mostly about making numbers look good — but now I realize it's about so much more.
It’s about deeply understanding the data, structuring it into a clear story, and simplifying it enough that anyone can grasp its meaning. And even after all that, you still have to make it visually compelling.
Honestly, I now fully understand just how much I don’t know. Designing something that makes sense to data experts while also being intuitive for sales teams was way harder than I expected.
I’ve gained so much appreciation for how much knowledge and skill it actually takes to simplify something so complex — and then, on top of that, make it look good.
Back